
“The fluctuation of average annual rates, as well as the generally downward trend of the rates in Chart 3, may have reflected the structural changes in the licensing market since the enactment of the America Invents Act (AIA) in 2011, which introduced inter partes review (IPR) proceedings in late 2012.”
 On September 26, Licensing Executives Society (LES) USA and Canada published the LES High Tech Sector Royalty Rates & Deal Terms Survey Report 2021. In May of this year, the 2021 Global Life Sciences Royalty Rates and Deal Terms Survey results were released. Together, the releases culminated the intense efforts by LES during the COVID-19 pandemic in preparing and launching the Surveys and in analyzing the data, presenting the results and writing the Reports.
Not only do LES Royalty Survey Reports provide an update on the licensing market in the past few years, they look into the dynamics of market evolution since the 2000s. The Reports offer benchmark royalty data by various categories, such as technology field and IP type, which serve as invaluable references for licensing professionals. The 2021 High Tech Survey Report is also the only data source in the IP industry that quantifies and publishes royalty rate premiums or discounts such as exclusivity premium and advanced-stage technology premium. Through identifying and quantifying the value contributions of key license parameters such as exclusivity, technology development stage and IP type, among others, the LES team aims to develop a build-up method for royalty determination, analogous to the build-up method in business valuation. For example, the royalty premium data can help licensing professionals determine a royalty rate when converting a non-exclusive license to an exclusive one or adjust royalty rate for early-stage vs. advanced-stage technology.
The LES Royalty Rates and Deal Terms Surveys: A Backgrounder
LES USA and Canada’s hallmark Royalty Survey Program includes three flagship Surveys, High Tech, Life Sciences, and Physical Sciences (formerly Chemicals, Energy, Environmental and Materials/CEEM). LES Life Sciences Sector spearheaded the Survey program by launching the first LES Life Sciences Survey in 2008, and has conducted six surveys since then. The Life Sciences Survey database contains the survey data from 2005 to 2021.
The inaugural High Tech Royalty Survey was conducted in 2011, covering the time period of 2008 to 2011. Since then, three additional surveys have been conducted in 2014, 2017, and 2021. With the 2021 Survey results, LES High Tech Royalty Survey has the data over a time span of 14 years from 2008 to 2021.
According to the schedule during the past several years, the Life Sciences Survey is supposed to be conducted every two years with a one-year interval, and High Tech Survey, every three years with a two-year interval. Both Surveys were scheduled for 2020 but were postponed for a year to 2021 because of the pandemic.
The third flagship Survey, the Physical Sciences Survey, known as CEEM Survey back then, was first launched in 2010. LES decided to reactivate the Survey in 2022. The Survey is currently ongoing, and is expected to close in November.
Over the years, LES USA and Canada has been working its parent organization LES International (LESI) through which to reach the country Societies over the world. However, the 2021 Surveys marked the first ever coordinated efforts in preparing and conducting the Surveys between LES USA and Canada on the one hand, and LESI and its other country Societies on the other hand. As a result, nearly a third of the High Tech Survey responses and a quarter of the Life Sciences Survey response were from international societies.
LES USA and Canada understands the concerns of those surveyed over confidentiality, and has taken multiple measures to address the issues from the very beginning. Since the 2000s, LES has used a third-party consultancy firm, Vault Consulting, to manage and perform the Surveys, including distributing the questionaries and collecting the results for each of the three Surveys. The LES teams do not have access to the identities of the submitters. All data provided by Vault is clear of confidential data and cannot, in any way, be tied back to any individual respondents.
Upon receiving the data from Vault Consulting, a team of volunteer analysts in LES will process data, conduct analysis, present results, and write reports. Traditionally, the Life Sciences Survey analysis team presents the Survey results in Power Point presentation, and its 2021 Survey presentation includes a total of 160 slides. By contrast, High Tech Survey analysis team chooses to write a report. The 2021 High Tech Survey Report has 54 pages with 17,000 words and 48 charts and tables. As an important element of the membership benefit package, LES offers all of its Reports from three flagship Surveys over the years for free to its members.
During the LES 2022 Annual Meeting in San Francisco from October 16 to 19, 2022, the analysis teams of the Life Sciences and High Tech Surveys will present the results by diving into the details and demonstrating how to leverage the Survey results to assist license negotiation and determine royalty rate.
Key Insights and Major Conclusions from the 2021 Royalty Surveys
The Life Sciences Royalty Survey was launched in June 2021 and closed in November 2021. The questionaries were sent to 4,164 LES USA and Canada members and the international members of LESI in Life Sciences sector. A total of 116 deals with completed information were collected.
The High Tech Royalty Survey was launched on July 14, 2021 and closed on November 30, 2021. The questionaries were delivered to more than 12,000 surveyees worldwide. A total of 58 submissions were made by survey respondents, and an additional 103 license deals were submitted by certain anonymous entities that chose to not use the survey questionaries.
The following sections summarize the major insights from the 2021 Surveys and illustrate how to use the insights to address the challenges in license negotiation and royalty determination.
1. An Update: What’s Been Happening in the Licensing Market over the Past Few Years
The analysis teams of the Life Sciences and High Tech Surveys tabulated the descriptive statistics of financial and non-financial terms by various categorizations, including organization type and size of the parties (licensees vs. licensors), the major reason for a deal or the rationales to enter a deal, peak sales of the licensed products, technology type, field of use, IP types licensed, technology development stage, and exclusivity, among various others. For IP professionals who need reference data handy, the descriptive statistics of royalty rates and lump sum payments in the Reports will offer highly useful benchmark data by the categories.
For example, 62% of all deals submitted in the Life Sciences Survey were in preclinical stage of development, and 67% of the deals in the High Tech Survey were in R&D, patenting (invention disclosure), and prototype stages. The average and median royalty rates reported by the 2021 High Tech Survey were 4.82% and 4.75% respectively. The average flat royalty rate for the earliest stage product was approximately 5%, according to the 2021 Life Sciences Survey.
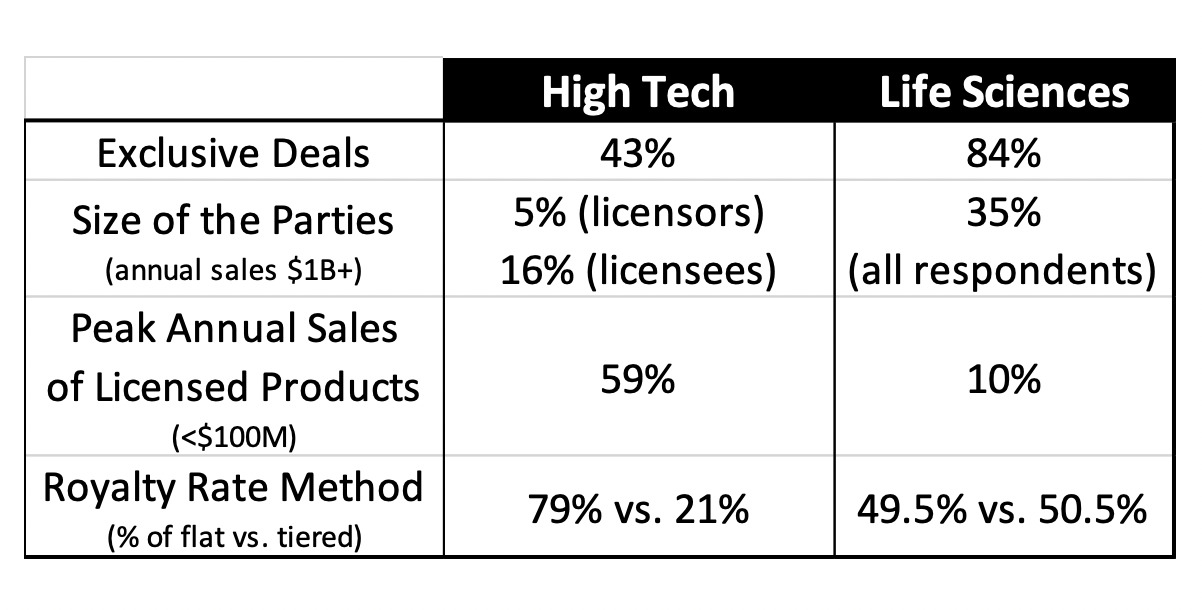
Comparing the 2021 Life Sciences and High Tech Surveys also yields some very interesting contrasts. As shown in Table 1 below, while 84% of the deals in the Life Sciences Survey were exclusive, exclusive deals accounted for only 43% of the deals in the 2021 High Tech Survey. Also, among the deals adopting percentage royalty rates, 79% of those in the High Tech Survey used flat rates, and 21% had tiered rates. By contrast, flat and tier rate methods essentially equally split the deals in the Life Sciences Survey. Additionally, it seems that the parties in the deals reported by the Life Sciences Survey tended to be larger than their counterparts in the High Tech Survey, and that the peak annual sales of most licensed products in the High Tech Survey were much smaller than those in the Life Sciences Survey.
Table 1. High Tech Survey vs. Life Sciences Survey: Some Examples
2. A Look Back: Historical View of the Licensing Market Since 2000s
The 2021 Life Sciences and High Tech Royalty Survey Reports also provide a review of the evolution of the licensing market since 2000s. As an example, based on the data from the past six Life Sciences surveys since 2009, the average royalty rate for preclinical deals across all therapeutic areas was 4.6%.
Chart 1, which is an adapted version of slide 60 of the 2021 Life Sciences Survey Report, offers further details about the royalty rate distribution of preclinical deals from the past six Life Sciences surveys. It shows that the 2021 Survey had a greater share of deals, with the royalty rate below 3%, and that prior surveys collected more deals with higher rates. This said, the general distribution of royalty rates for preclinical deals in the 2021 Survey was similar to the earlier surveys, according to the 2021 Life Sciences Survey Report.
Chart 1. Distribution of Flat Royalty Rates for Preclinical Deals:
The Past Six Life Sciences Surveys Since 2009

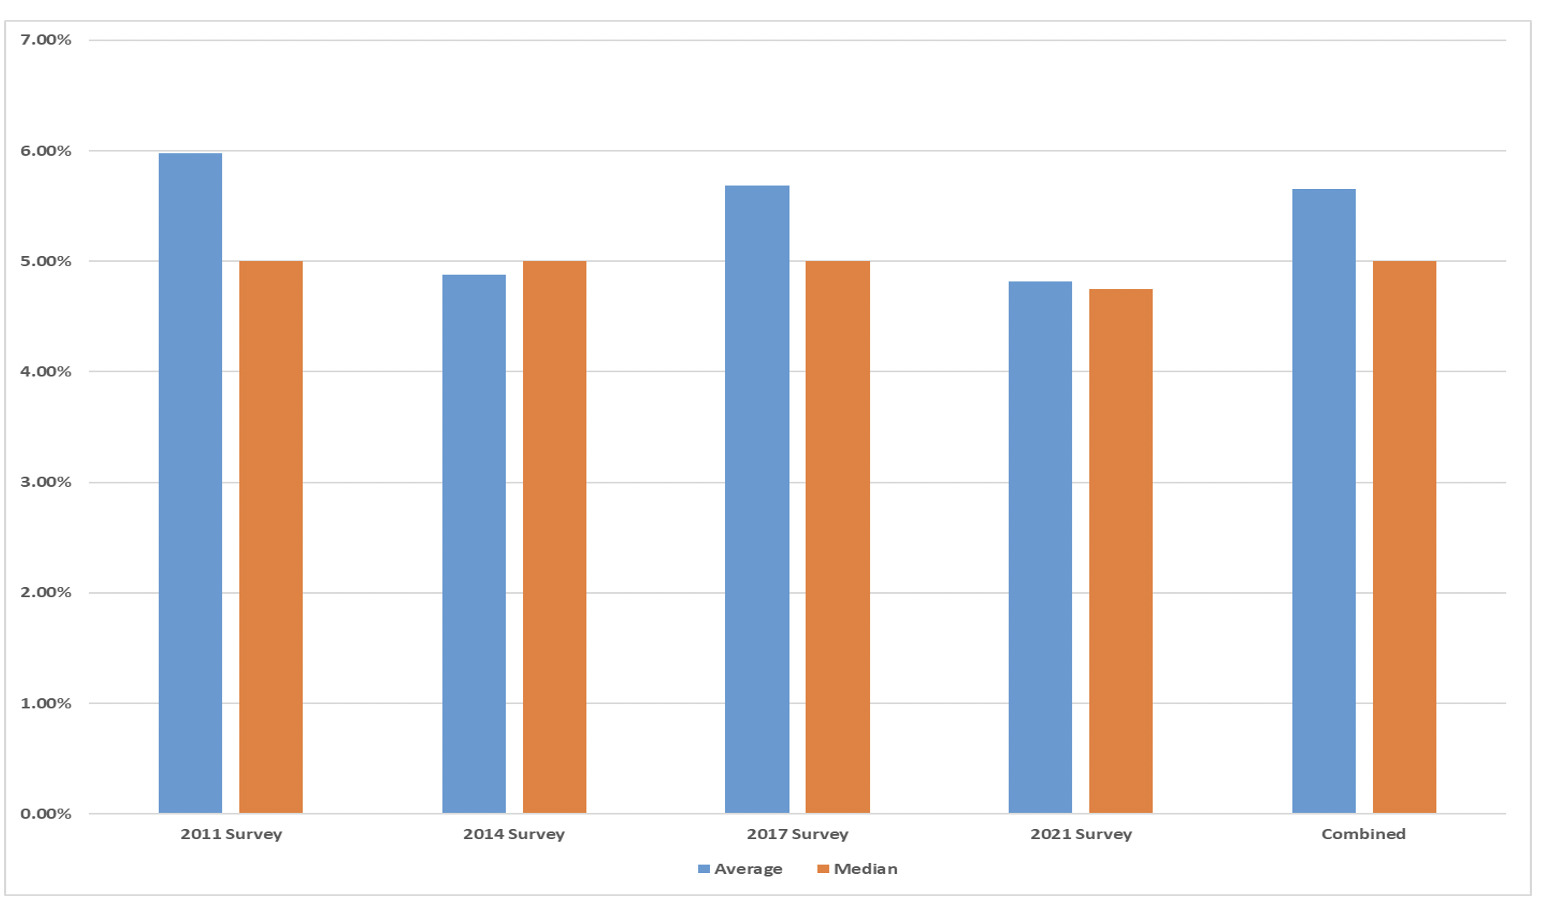
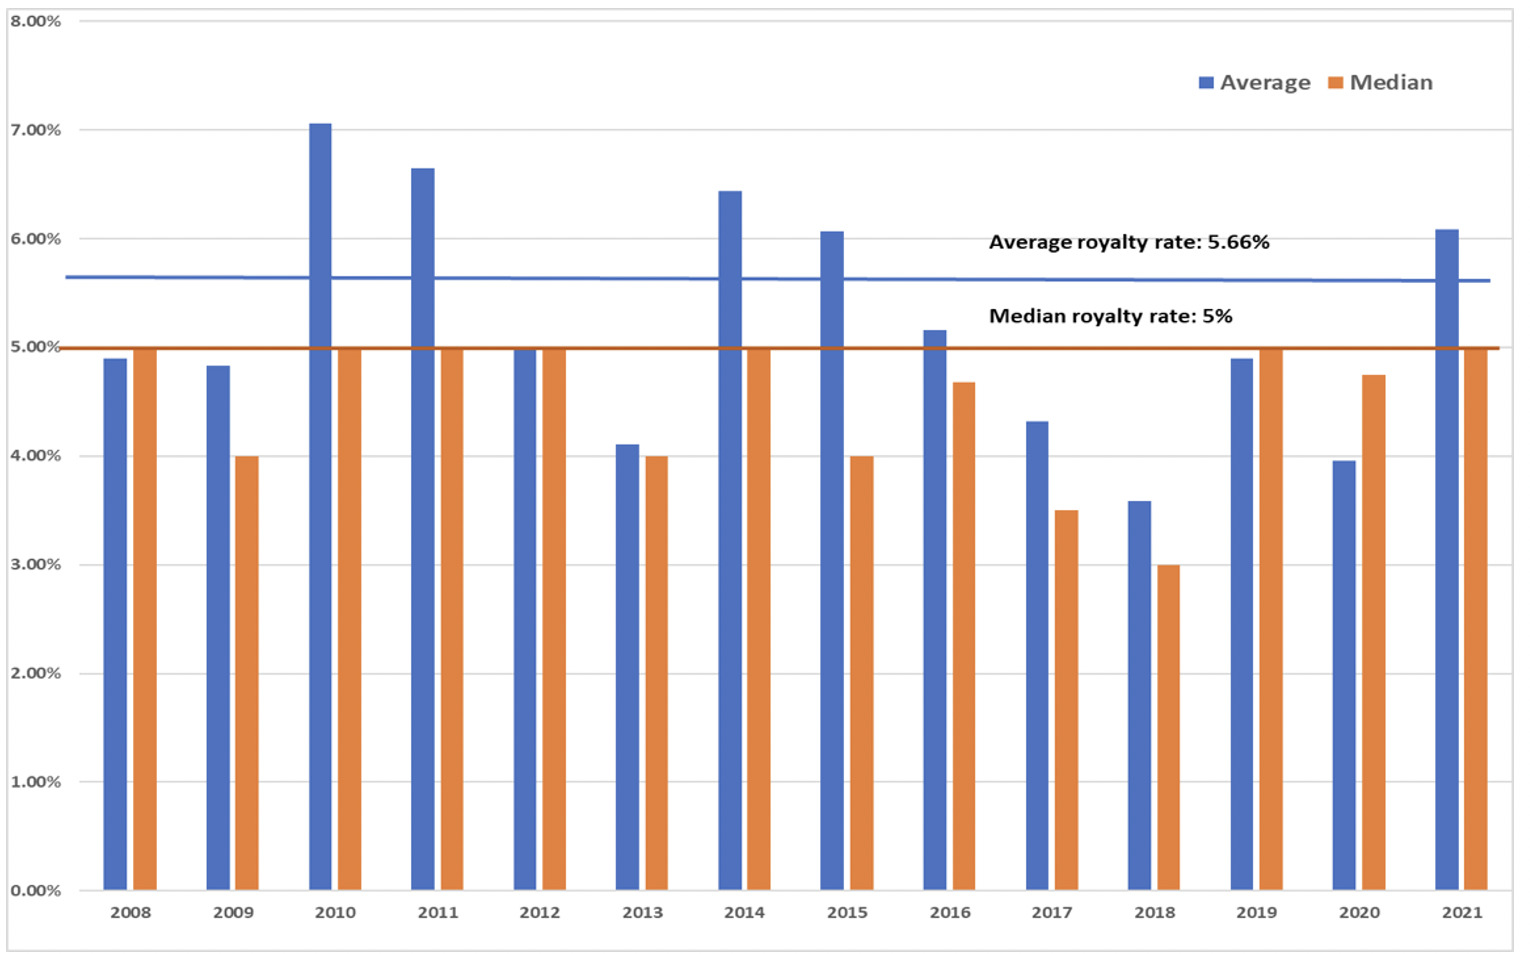
The 2021 High Tech Royalty Survey Report calculates the average and median royalty rates for each of the four surveys, as shown in Chart 2. The chart displays that the average royalty rates fluctuated across the four surveys but generally trended down since the 2011 Survey. By contrast, the median royalty rates tended to be relatively stable, remaining at 5%, despite the dip in the 2021 Survey. The 2021 High Tech Royalty Survey Report also presents annual average and median rate for each year since 2008, which provides additional details about the dynamics of the licensing market as reflected by the changes in royalty rates, as demonstrated by Chart 3.
Chart 2. Average and Median Royalty Rates: 2021, 2017, 2014 and 2011 High Tech Royalty Surveys
The fluctuation of average annual rates, as well as the generally downward trend of the rates in Chart 3, may have reflected the structural changes in the licensing market since the enactment of the America Invents Act (AIA) in 2011, which introduced inter partes review (IPR) proceedings in late 2012, as covered in great detail in the 2017 High Tech Survey Report. The effects of the AIA and IPRs were further compounded by the impact from a series of rulings by the U.S. Supreme Court since then, including Mayo v. Prometheus (2012), Alice v. CLS Bank (2014), TC Heartland v. Kraft Foods Group Brands (2017), and Oil States v. Greene’s Energy (2018), among various others. The peaks and troughs in Chart 3 vividly illustrate how the licensing market reacted to, and priced the effects of, these major events.
Chart 3. Annual Average and Median Royalty Rates: 2008 – 2021
LES High Tech Royalty Surveys
Econometric analysis in the 2021 High Tech Survey Report lends further testimony to the valuation impact of these events. The declines in royalty rates and lump sum payments during the post-AIA/IPR and especially post-Alice period are statistically significant, reflecting the fact that the parties in the licensing market have been adjusting their risk-return expectations based on their assessment of the effects of such events on licensing negotiation. While declining royalties reduce the licensing income for patent licensors, it saves royalty cost for licensees. The regression analysis also indicates that most of the effects from the market factors may have been exerted through changing the practices of licensing, which in turn, alters the value contributions of major license parameters such as exclusivity and technology development stage etc..
3. Applying Insights from Royalty Surveys to Assist License Negotiation and Determine Royalty Rate: Toward an LES Build-up Method for Royalty Determination
In addition to providing an update on current status of the licensing market and a historical view of market evolution since 2000s, the 2021 LES Royalty Survey Reports, based on the deep insights revealed from the data, have developed some invaluable solutions and methods for licensing negotiation and royalty determination.
For example, innovation economics dictates that technologies in advanced stages, compared to their peers in early stages, have much lower technical risk and less market uncertainty, and accordingly shall command price premiums in the licensing market. The 2021 LES Life Sciences Survey Report has offered direct empirical evidence to support this theory.
Chart 4, which is made from the data disclosed in slide 58 of the LES 2021 Life Sciences Survey Report, displays the average royalty rate of the deals with technologies that have achieved proof of concept (POC) stage, in contrast to that of the deals with technologies that have not. The multiplier of the post-POC rate over pre-POC rate, as implied by Chart 4, provides a very useful pricing guide for licensing professionals to negotiate a reasonable royalty rate when the stage of technology development is among the key value-determining factors.
Chart 4. Average Royalty Rate by Stage of Development: Pre-POC vs. Post-POC
Based on the data from the 2021 Life Sciences Survey Report
 The 2021 LES High Tech Report has a similar chart, though based on a different categorization of technology development stages, which includes R&D, patenting (i.e., invention disclosure), prototype, fully developed and in production. The Report shows that technologies at their advanced stages in technology development cycle, i.e., at fully-developed stage or in-production stage, would command much higher royalty rate than those in earlier stages.
In light of this observation, the LES 2021 High Tech Survey Report uses econometric models to identify and quantify the value contributions of key parameters of license deals, measured by royalty premiums or discounts. For example, according to the analysis on royalty rate samples, by technology type, the technologies in aerospace, software, medical and healthcare areas carry significant royalty premiums. So do exclusive licenses, the deals with technologies in their advanced stages, and those involving knowhow, drawings and designs.
Among the important advantages of econometric analysis is that it is able to identify and quantify the royalty rate premiums or discounts after controlling for the valuation effects of all other significant license parameters and market factors. In other words, a premium or discount yielded by econometric analysis represents the pure or net valuation contribution of the corresponding market factor or license parameter, after isolating and removing the valuation effects of all other significant compounding elements.
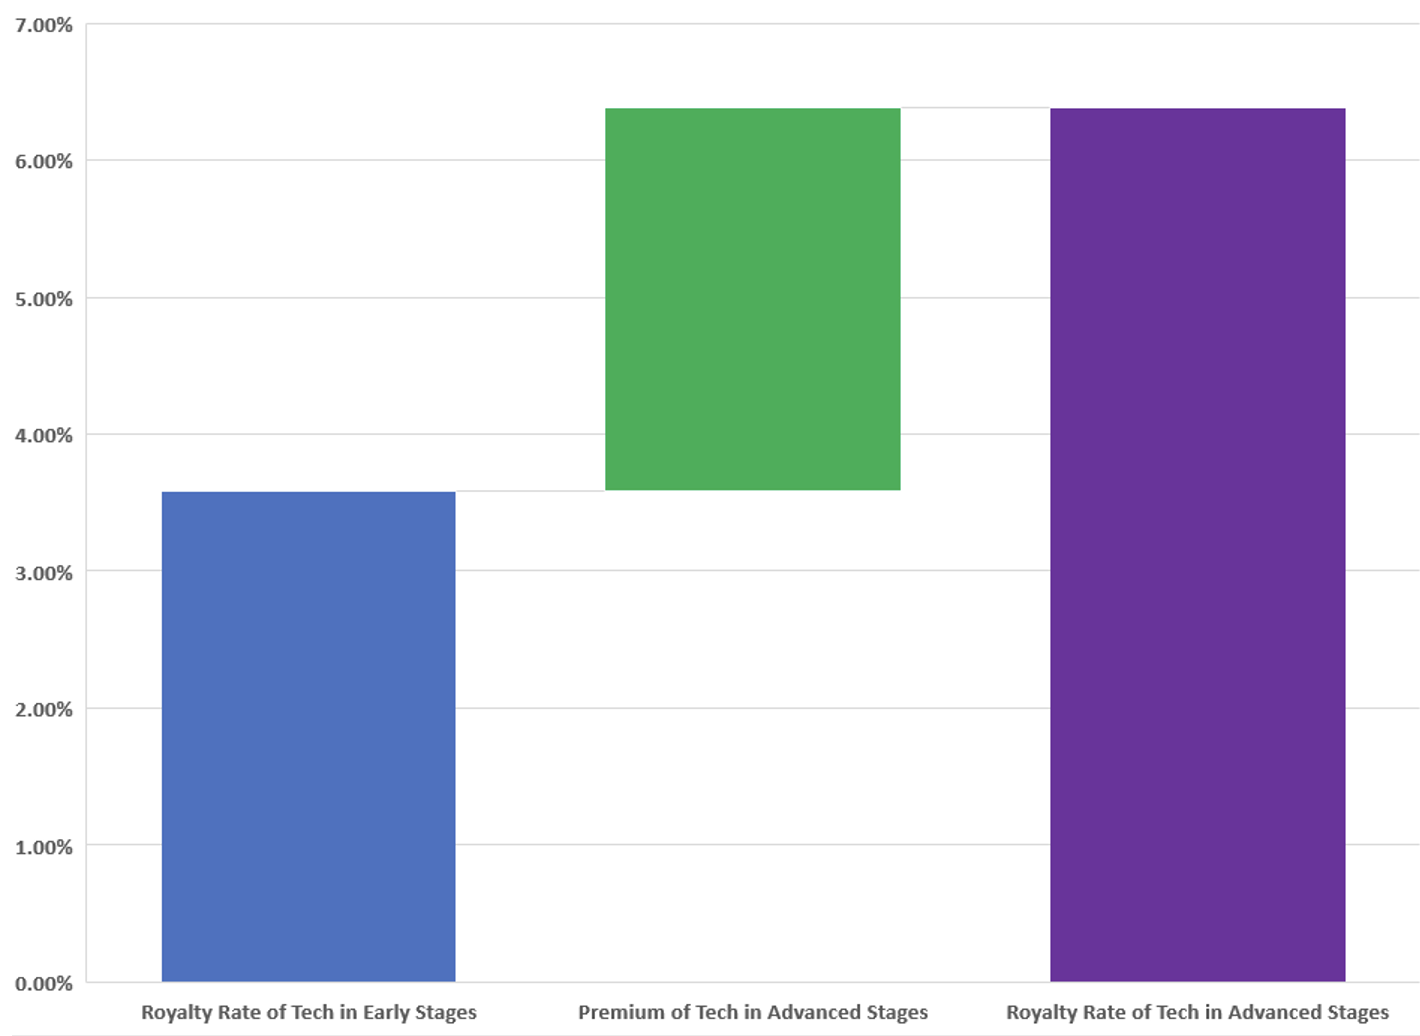
Chart 5 below illustrates how the LES High Tech Royalty Survey Report applies the advanced-stage technology premium from econometric analysis for royalty rate determination. Essentially, starting from the royalty rate for a license with early-stage technology, one can build up the royalty rate for a license with advanced-stage technology by simply adding the advanced-stage premium to the royalty rate of the early-stage technology. Similarly, one can use the exclusivity premium to determine the royalty rate when converting a non-exclusive license to an exclusive one; or vice versa.
During the LES USA and Canada 2022 Annual Meeting , the LES High Tech Royalty Survey analysis team will walk through a case study of how to adjust royalty rate in a nonexclusive license with advanced-stage technology to determine the royalty rate for an exclusive license with early-stage technology, by applying the exclusivity premium and the advanced-stage premium quantified in the Survey Report.
The ultimate goal of the LES Royalty Surveys is to develop a royalty valuation method that would be analogous to the build-up method in business valuation. The assumptions are that each parameter (such as exclusivity, technology development stage, IP type, and licensor organization types, among various others) of a license agreement has its own value contribution to royalty determination and that the royalty stipulated in an agreement reflects the value contribution from each of the parameters.
Chart 5. Premium for Advanced-Stage Technologies
Based on the data from the 2021 High Tech Survey Report
![[Advertisement]](https://ipwatchdog.com/wp-content/uploads/2024/04/Patent-Litigation-Masters-2024-sidebar-early-bird-ends-Apr-21-last-chance-700x500-1.jpg)

![[Advertisement]](https://ipwatchdog.com/wp-content/uploads/2021/12/WEBINAR-336-x-280-px.png)
![[Advertisement]](https://ipwatchdog.com/wp-content/uploads/2021/12/2021-Patent-Practice-on-Demand-recorded-Feb-2021-336-x-280.jpg)
![[Advertisement]](https://ipwatchdog.com/wp-content/uploads/2021/12/Ad-4-The-Invent-Patent-System™.png)


Join the Discussion
No comments yet.