
![[IPWatchdog Logo]](https://ipwatchdog.com/wp-content/themes/IPWatchdog%20-%202023/assets/images/temp/logo-small@2x.png)

 2
2 “American inventors became a minority in their own patent office. They never took the majority back.” – RTI Patent Index
 Red Tape Index (RTI), a project of the regulatory intelligence platform Labrynth, published a patent index today placing the United States Patent and Trademark Office (USPTO) below every peer office measured on the price, speed, and openness of the patent system. The Patent Friction Index assigned the United States a composite score of -42.62, a figure that stayed negative under every alternative scoring rule tested.
The index, described by its publisher as “a new benchmark measuring the speed and flow of patents in the U.S. and globally,” compared five patent offices: the USPTO, the European Patent Office (EPO), the China National Intellectual Property Administration (CNIPA), the Japan Patent Office (JPO), and the Korean Intellectual Property Office (KIPO). It evaluated each office based on four measures, including patent fees through 120 months, average pendency, the share of grants awarded to independent inventors, and the share awarded to foreign applicants. Each measure produced a score of zero to 100 among the offices, and the U.S. distance from a parity line—the median score of the four peer offices— is its own score minus that line.
Looking specifically at official fees, the United States charged $5,440 in official fees, the second highest of the five offices behind Europe’s $14,319 and above South Korea’s $2,744, China’s $3,102 and Japan’s $2,549, the lowest of the group. That comparison produced a distance of -21.39, and the pillar covers statutory fees only, since attorney and translation costs are excluded across all five offices.
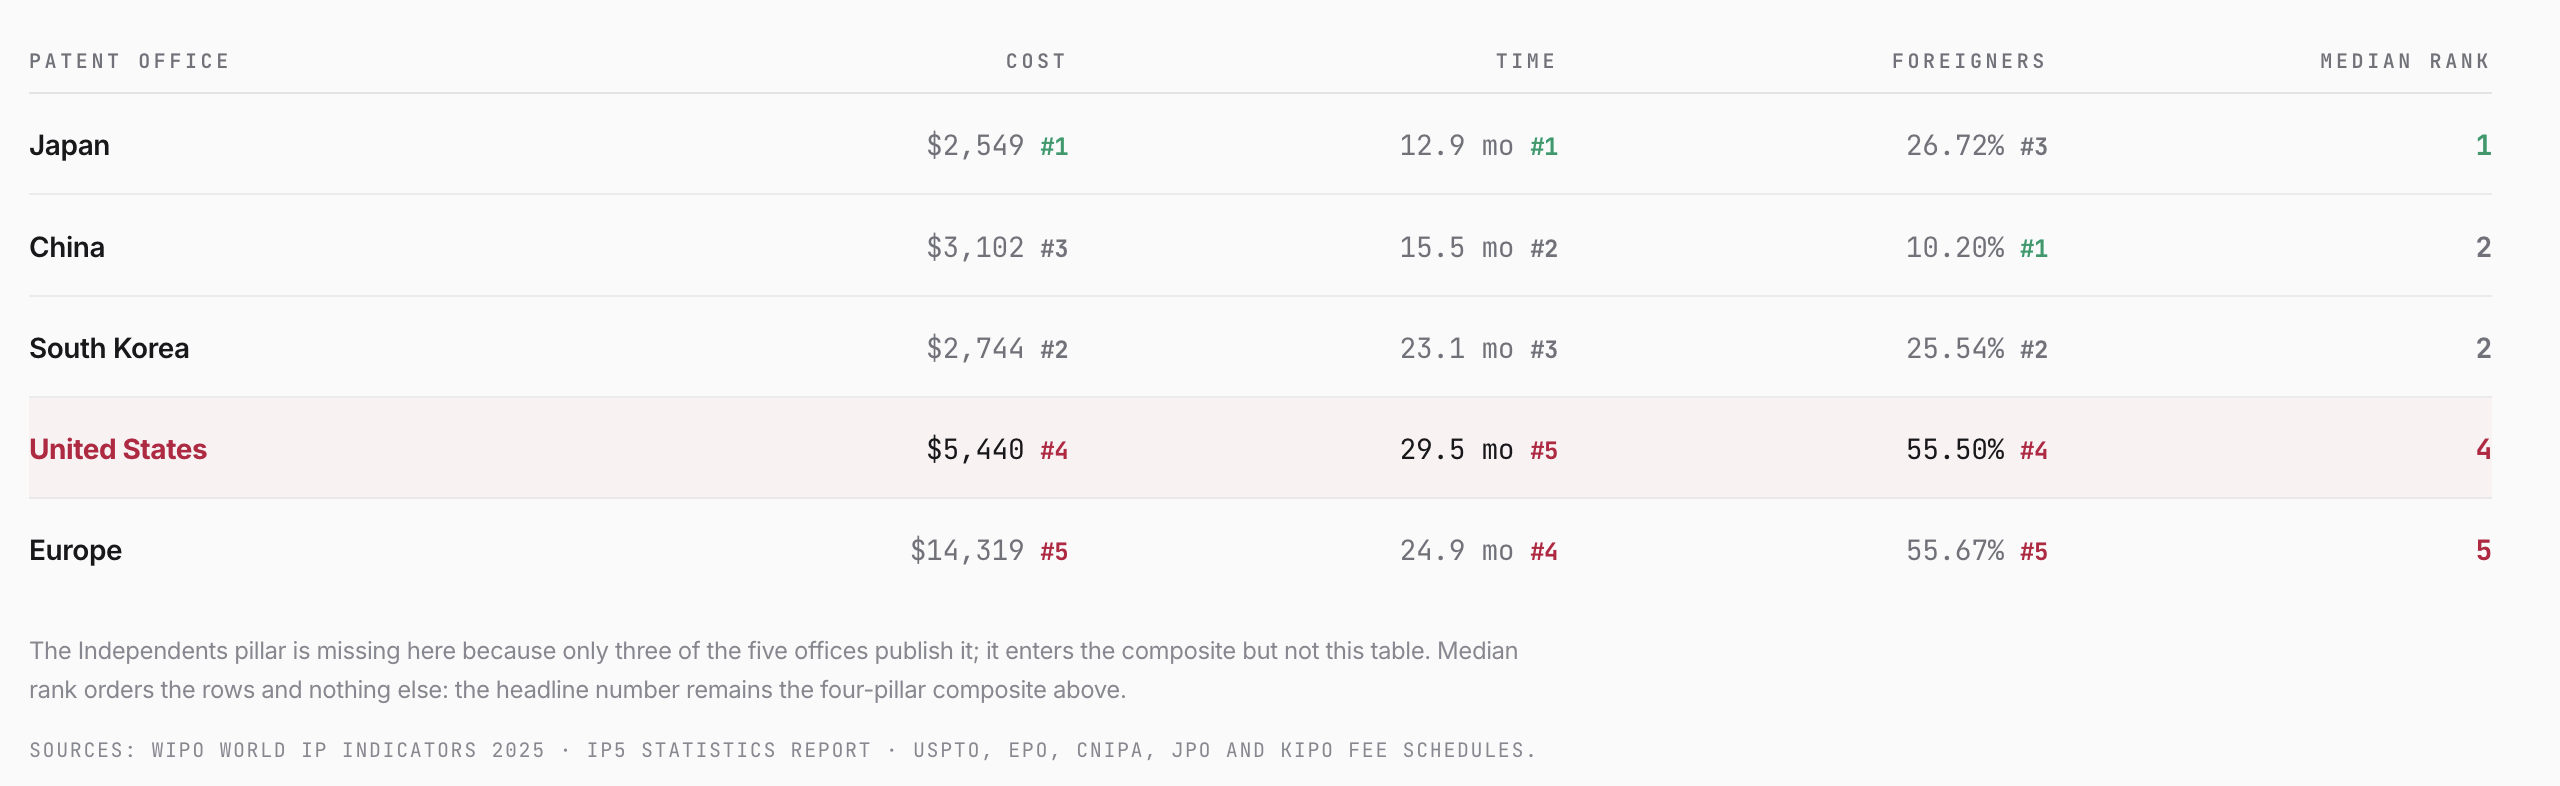
In terms of pendency, the United States averaged 29.5 months to a final decision in 2024, the slowest of the five offices, trailing Europe at 24.9 months, South Korea at 23.1 months, China at 15.5 months and Japan at 12.9 months. That gap produced a distance of -61.45, which is the widest of the four measures. The report tracked the gap between 2021 and 2024 and found the United States added 8.3 months of waiting time relative to the peer median over that period, while Japan cut 2.4 months from its own pendency.
Only three of the five offices publish figures for independent inventors, and the United States recorded 8.2% of its home country grants going to a person rather than a corporate applicant, compared with 19.8% in South Korea and 3.8% in China, producing a distance of -23.05. On foreign share, 55.50% of United States grants in 2024 went to applicants based outside the country, nearly matching Europe’s 55.67% and far above China’s 10.20% , the largest single distance in the composite at -64.59. The report said the United States “is first in nothing, and bottom-two on all three pillars” the offices all publish.
“The goal is not to discourage international inventors from seeking U.S. patents,” said Labrynth founder Stuart Lacey in a press release published today. “It is to give policymakers, businesses and inventors a clearer picture of how accessible the system is and where there may be opportunities to make it work better for the people who need it most.”
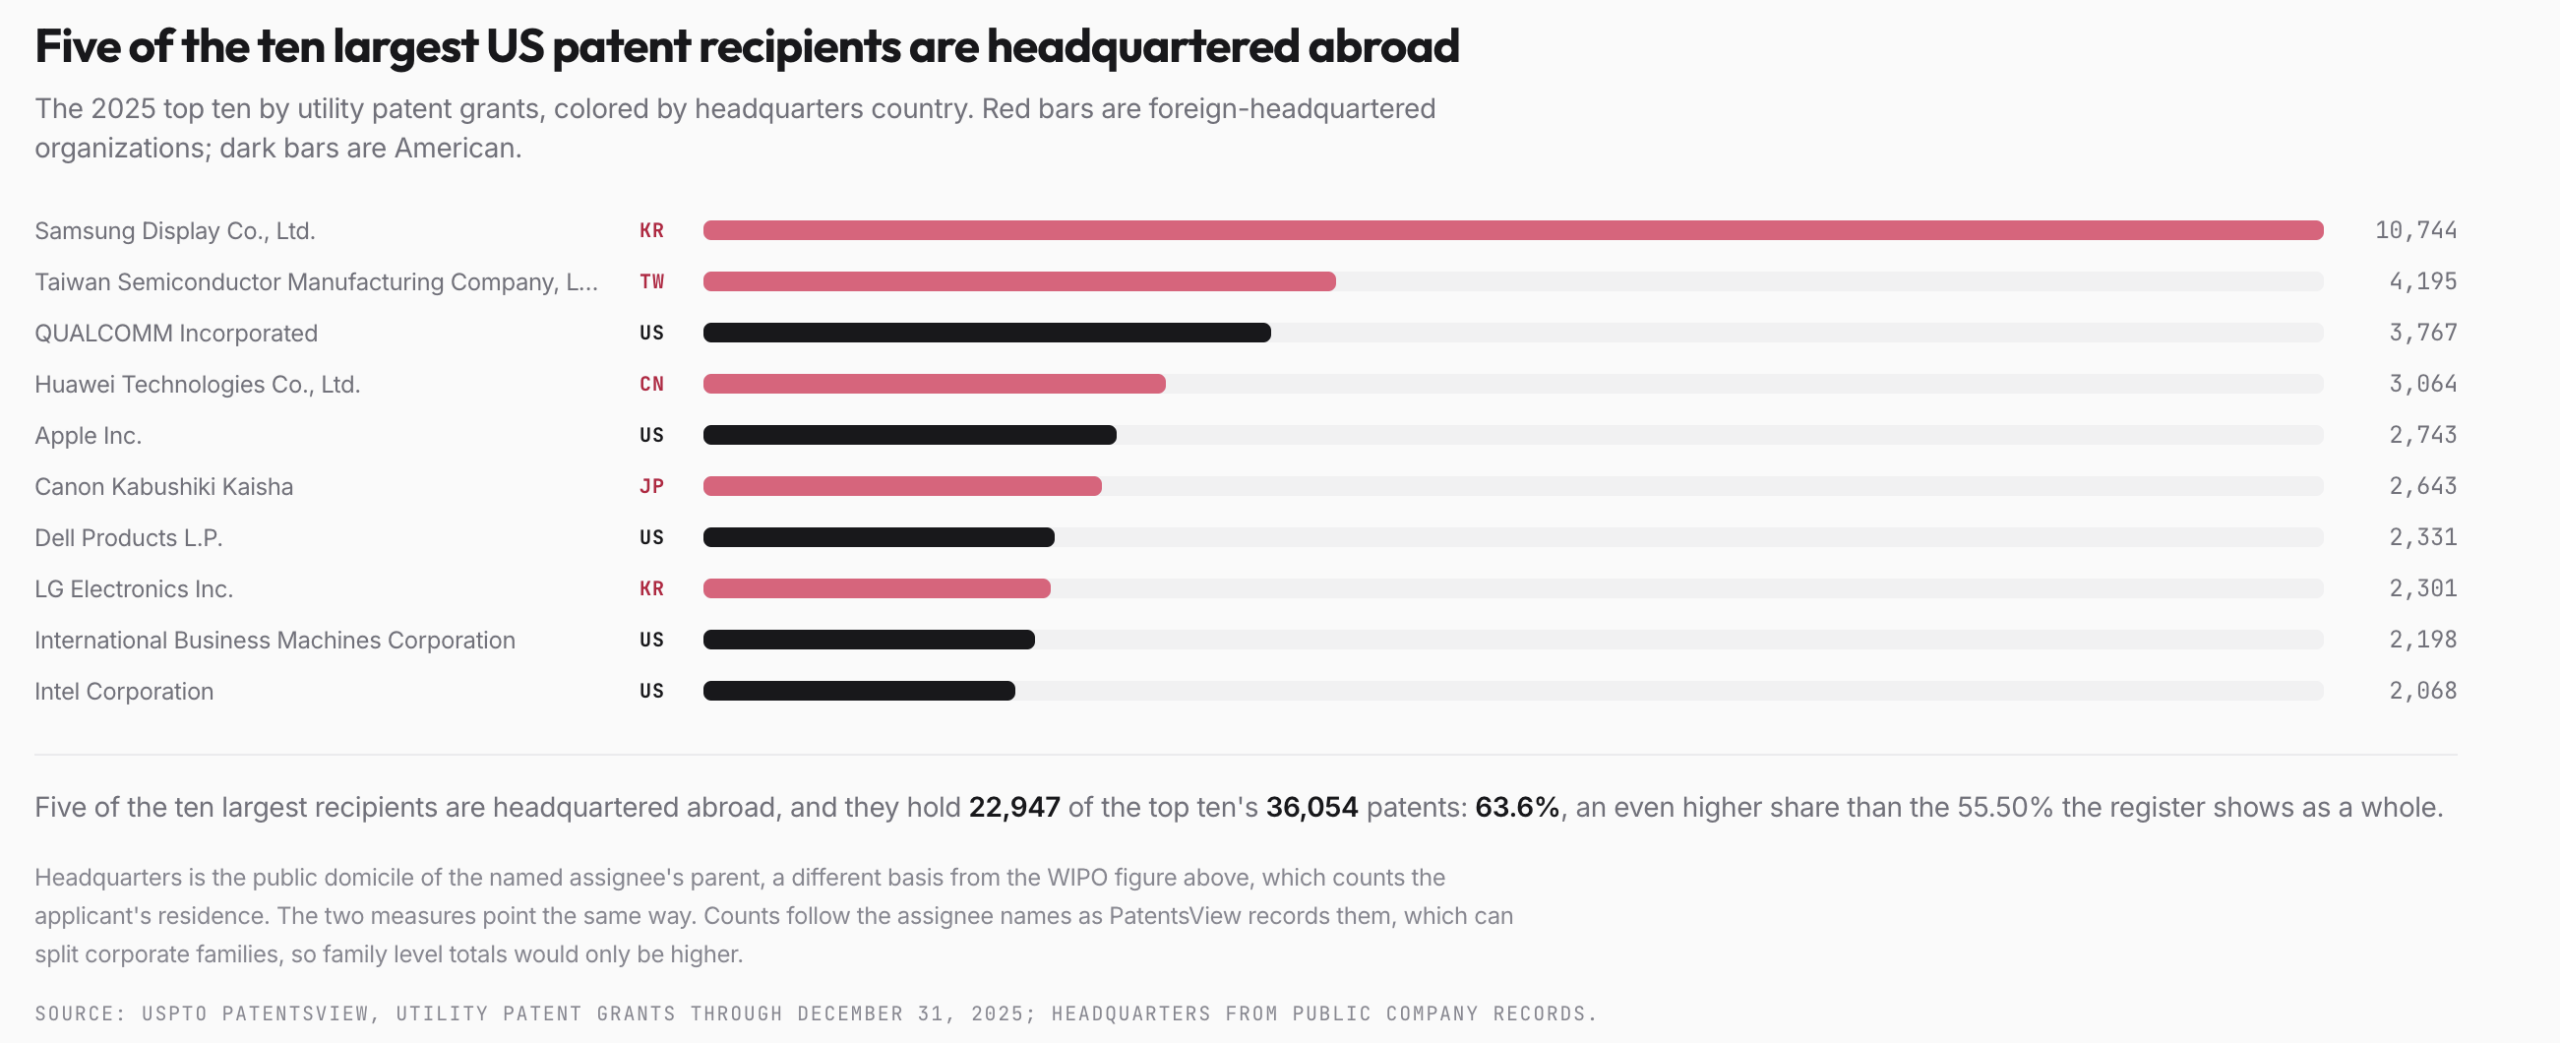
The report also measured concentration among the ten largest recipients of a utility patent grant in 2025, ranked by the headquarters of the parent organization. Samsung Display Co., Ltd., based in South Korea, led with 10,744 grants, followed by Taiwan Semiconductor Manufacturing Company, Ltd. with 4,195, Qualcomm Incorporated with 3,767, Huawei Technologies Co., Ltd. with 3,064 and Apple Inc. with 2,743. Five of the ten largest recipients were headquartered abroad and together held 63.6% of the top ten’s combined grants, which exceeded the 55.50% foreign share found in the register overall. The report traced the foreign majority to 2008, writing that “American inventors became a minority in their own patent office. They never took the majority back.”
In addition to the five office comparisons, the index drew on USPTO records to examine domestic patenting trends dating back to 1976. The share of granted patents naming no company, used as a proxy for an independent inventor, peaked at 22.3% in 1980 and fell to 5.1% in 2025. When applications filed between 2005 and 2017 are pooled, large applicants secured a grant on 58.4% of filings, compared with 41.7% for small applicants. The gap never dropped below 14 percentage points and reached 20.6 points in 2015.
Abandonment followed a similar pattern, with small applicants walking away from 27.7% of applications before any decision, compared with 25.3% for micro entities and 18.5% for large applicants. In 2022 alone, small and micro applicants abandoned 27,751 applications, one every 18.9 minutes, without responding to an examiner.
Furthermore, companies received 12,809 AI-related patents in 2025, compared to 615 for universities, and 42 for individuals. The share of published applications with AI in the title also rose from 0.62% in early 2018 to 2.56% by mid-2024 and a 4.1-fold increase.
The methodology cautioned that the drill down measures outcomes rather than causes, since a gap in grant rates does not by itself establish examiner bias. On the weighting behind the composite, the report acknowledged that “equal weights are a choice, not a finding,” and tested three alternative parity rules along with a version dropping the weakest pillar. Under every version, the score stayed negative, ranging from -74.31 under the strictest rule to -27.39 under the most lenient one.
![[Advertisement]](https://ipwatchdog.com/wp-content/uploads/2026/08/IP.com-Sep-3-2026-sidebar-700x500-1.jpg)
![[Advertisement]](https://ipwatchdog.com/wp-content/uploads/2026/09/IP-Copilot-Sep-8-2026-sidebar-700x500-1.jpg)
![[Advertisement]](https://ipwatchdog.com/wp-content/uploads/2026/06/Womens-IP-Forum-2026-sidebar-regular-price-700x500-rev1.jpg)
![[Advertisement]](https://ipwatchdog.com/wp-content/uploads/2026/08/OneTransform_700x500_v1-REVISED.jpg)
![[Advertisement]](https://ipwatchdog.com/wp-content/uploads/2026/07/Juristat-Varsity-Ad-2026-IPW-ad-FreeTrial_1-UPDATED-on-Jul-15-2026.png)
![[Advertisement]](https://ipwatchdog.com/wp-content/uploads/2024/09/Patent-Prosecution-Training-sidebar-700x500-2025-03-27.jpg)







![[Advertisement]](https://ipwatchdog.com/wp-content/uploads/2021/12/WEBINAR-336-x-280-px.png)
![[Advertisement]](https://ipwatchdog.com/wp-content/uploads/2021/12/Ad-4-The-Invent-Patent-System™.png)




Join the Discussion
2 comments so far. Add my comment.
Max Drei
August 16, 2026 11:59 amIs anybody surporised that only 10% of Chinese patents are held by non-Chinese owners? Is anybody surprised that the EPO and the USPTO are equal with betweeen 55 and 60 % of the patents they grant going to non-domestic owners? Is anybody advocating pulling that 55% figure down to nearer 10%? If so, why?
And how about Korea and Japan? What proportion of the patents they grant go to non-domestic owners? My guess: both about 20%. Is that something to aspire to?
Randall Rader
August 16, 2026 09:35 amThank you, Ms. Esfandiari, for this enlightening, though somewhat disturbing, comparison of patent offices. rrr
Add Comment