
“The market continues to change and transform. For those, like us, who participate in it, we will continue to take our punches, but there is more than enough fight to win.”
This is the last of a six-part series on Richardson Oliver Insights’ 2018 Patent Market Report.
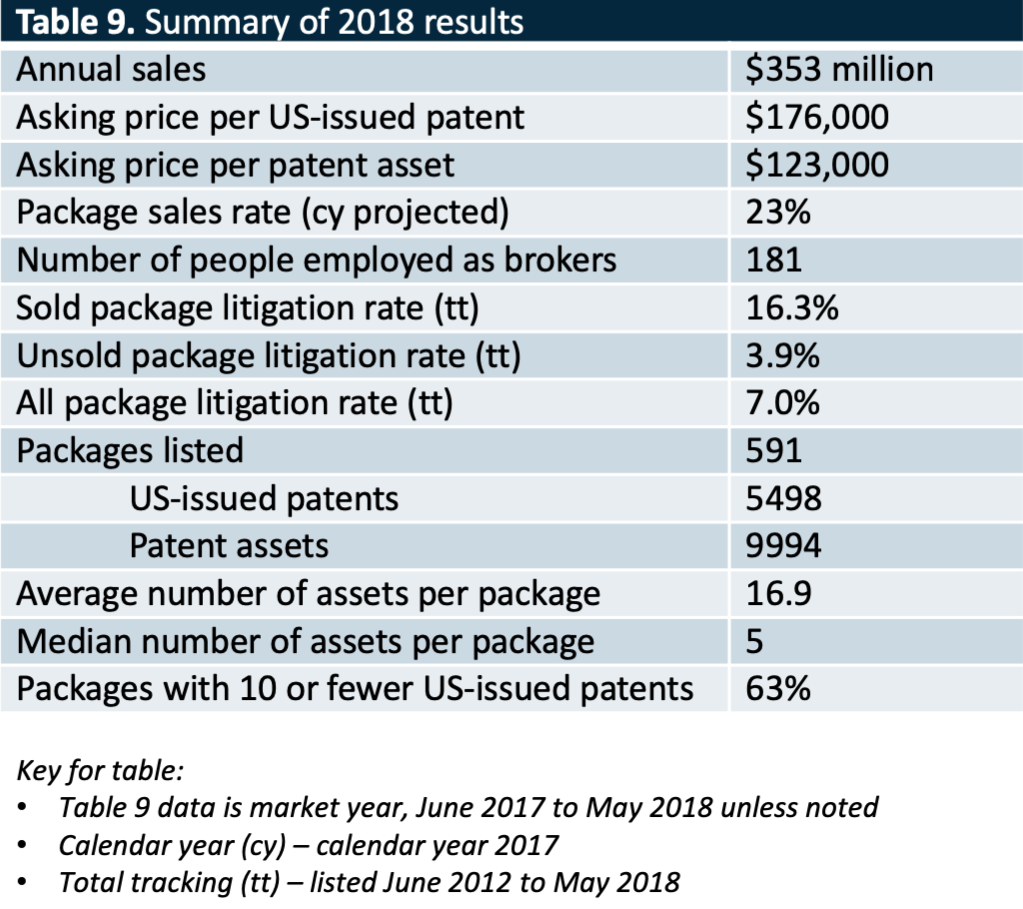
Despite falling average prices, in 2018, the patent market grew fast. We estimate the 2018 market size to be $353 million, up from last year’s estimated $296 million. The 2016 market slump (estimated $165 million market) is, hopefully, a thing of the past.
In order to make this estimate, we use the observed sales that occurred in the 2018 market year and used their actual asking prices to determine the market size. As is consistent with the previous two years, if no pricing guidance was provided, the average asking price per asset for the market year of the sale (eg $123,000 for 2018 market year sales), was multiplied by the number of assets to determine the expected asking price. In the 2018 market year, 210 sales were identified, accounting for a total asking price of $527 million. Due to recordation delays, we assume that we have not yet seen 3% of the sales that occurred in the timeframe, so we multiplied this total asking price by 1.03 before applying our standard 35% discount between asking price and expected selling price. Thus, our expected total market size for the 2018 market is $353 million, indicating that the market has increased by 19% since last year and 114% since the 2016 market.
As a check on our methodologies, we looked at the updated sales data to recalculate last year’s market size. We now calculate the 2017 market to have been $299 million instead of our estimate of $296 million in last year’s article, confirming our approach to estimating market size.
By applying an average commission rate of 20%, the revenue from this market for brokers is $54 million per year (we eliminated “for sale by owner” listings). We dropped the average commission rate from 25% last year to more accurately represent the types and structure of packages listed this year. By estimating the average loaded labor rate per broker ($300,000 a year), we calculated that there are 181 full-time equivalent employees working as brokers. Assuming that three brokers work in each brokerage, this results in approximately 60 brokerages. Our data shows 56 brokerages that listed packages in the 2018 market.
Opportunities, Conclusions and Reflections
Two years ago, the cover of IAM Magazine showed a beaten boxer stumbling to his feet, representing a patent market struggling to recover from the brink of disaster. With asking prices down 30%, each punch isn’t as strong as it was. But the boxer is nimbler, and with 53% more transactions than two years ago, he’s landing a lot more punches. The overall market grew by nearly 20% this year and is more than double our 2015 estimate. As the market continues to mature, our fighter has had to become more versatile and adaptable. Litigation continues to increase for sold assets and, in response, so do IPRs. Brokers continue to sell patents, some at a much higher rate than others. NPEs are still buying. Evidence of Use materials still matter. With the increasing importance of international assets, our boxer may have even started training as a southpaw.
We can confidently say that the market is moving forward and operating well. The market continues to change and transform. For those, like us, who participate in it, we will continue to take our punches (e.g. lower prices for single-asset deals), but there is more than enough fight to win. Further, the benefits of multiple years of greater pricing transparency are starting to show, with the standard deviation in prices contracting again this year. With more data at our disposal we can rely on analysis and prepare ahead of time using data analytics, diligence optimization, and strategy development. Our overall advice is not that far from that of a boxing coach—if you want to win in this market you have to put in your hours at the gym.
Action Plan
When buying patents:
- state the business case for buying—identify the specific problem that you are trying to solve;
- model a return for your buying program;
- arrange your buying operations to reflect that over 90% of the patents will not fit your needs—eliminating those patents from consideration early will greatly reduce your costs; and
- operationalize your buying program as much as possible; this is becoming more common and is, therefore, more important for all buyers.
Program parameters include:
- timeline – packages that are selling continue to sell quickly;
- budget;
- buying team authority and responsibilities;
- buying criteria;
- listing of acceptable sources of patent packages; and
- special requirements, such as a whitelist of unlicensed companies.
The following is a fail-safe triage process for eliminating undesirable packages quickly:
- Extract criteria from the business case to identify interesting markets and technologies, and then define the diligence needs.
- Undertake a multi-part analysis of markets, technical knowledge and legal analysis where a failure in any one area eliminates the package from further review.
- Track basic information about your program so that you can learn from your past.
Tips for bidding and buying:
- Build a valuation model to determine a maximum bid price.
- Assume that diligence will take longer than planned.
- Consider adding a consulting agreement with the inventors if they are available.
Methodology
As the brokered patent market matures, access to data has increased. However, the market remains fairly opaque. Therefore, to analyze the market we pull data from many sources, combining this with a proprietary set of tools that we have designed in-house.
Our data sources include our proprietary patent package database, the USPTO patent data (Public-Pair), the USPTO Assignment database, Derwent Innovation, PatSnap and litigation data from DocketNavigator and Darts-IP.
This data is then combined on both a per patent and per package basis, using tools we have developed over the last five years. The result is a proprietary database of hundreds of thousands of records across nearly 500 fields. These tools are programmed in SQL, R, Ruby, AppleScript, and VBA using ODBC to retrieve up-to-the-minute live data from our database. We also use business intelligence tools such as Tableau. We continue to expand our capabilities to sort, sift and visualise the data.
We also internally track asking prices, bidding dates, and clients’ specific diligence decisions and maintain a list of unique entities which are buying and selling with standardized names. We even classify these entities by entity type which means we have our own internal list of companies we believe to be non-practicing entities. Though this process is quite time-consuming, we believe that using real data to back up our conclusion is the best way to provide accurate analyses to our clients and lower the barrier to entry for companies joining the market.


![[Advertisement]](https://ipwatchdog.com/wp-content/uploads/2024/04/UnitedLex-May-2-2024-sidebar-700x500-1.jpg)
![[Advertisement]](https://ipwatchdog.com/wp-content/uploads/2024/04/Artificial-Intelligence-2024-REPLAY-sidebar-700x500-corrected.jpg)
![[Advertisement]](https://ipwatchdog.com/wp-content/uploads/2024/04/Patent-Litigation-Masters-2024-sidebar-700x500-1.jpg)

![[Advertisement]](https://ipwatchdog.com/wp-content/uploads/2021/12/WEBINAR-336-x-280-px.png)
![[Advertisement]](https://ipwatchdog.com/wp-content/uploads/2021/12/2021-Patent-Practice-on-Demand-recorded-Feb-2021-336-x-280.jpg)
![[Advertisement]](https://ipwatchdog.com/wp-content/uploads/2021/12/Ad-4-The-Invent-Patent-System™.png)


Join the Discussion
No comments yet.