
“SEP determination is complex and too often subject to systematic bias…. Cleaned and curated patent declaration data can serve as one reference point among others… [but] such evidence must be thoroughly evaluated to make accurate assumptions about the essentiality, value and market share of a given SEP portfolio.”
 When licensing standard essential patents (SEPs), the SEP licensor and the standard implementer (also known as the SEP licensee), go through two phases of negotiation. The first phase is the technical phase, followed by the second phase, the commercial discussion. In the technical phase, the SEP licensor must provide evidence that at least one patent of its portfolio is valid and standard essential. This is done by providing rigorously conducted claim charts that map claims against the standard’s sections, providing evidence that all claim elements read on the technical standard specification. Typically, only a few claim charts are needed in this first technical phase, since only one patent must be valid and essential to make the case that the standard implementing party is infringing.
The second phase, the commercial discussion, is much more complex. Here, the SEP owner must provide evidence of the value of its SEP portfolio for a given standard supporting why the proposed royalty rate is FRAND (fair reasonable and non- discriminatory). SEPs are not licensed individually, and license agreements typically never list all patents covered by the SEP license. Instead, SEP owner draft contracts that guarantee access to all patents valid and essential for a given standard, including patents yet pending and including patents filed in the future until the expiration of the SEP license agreement. For larger SEP portfolios, SEP owners will therefore not provide claim charts for every patent.
Self-Declared Patent Databases
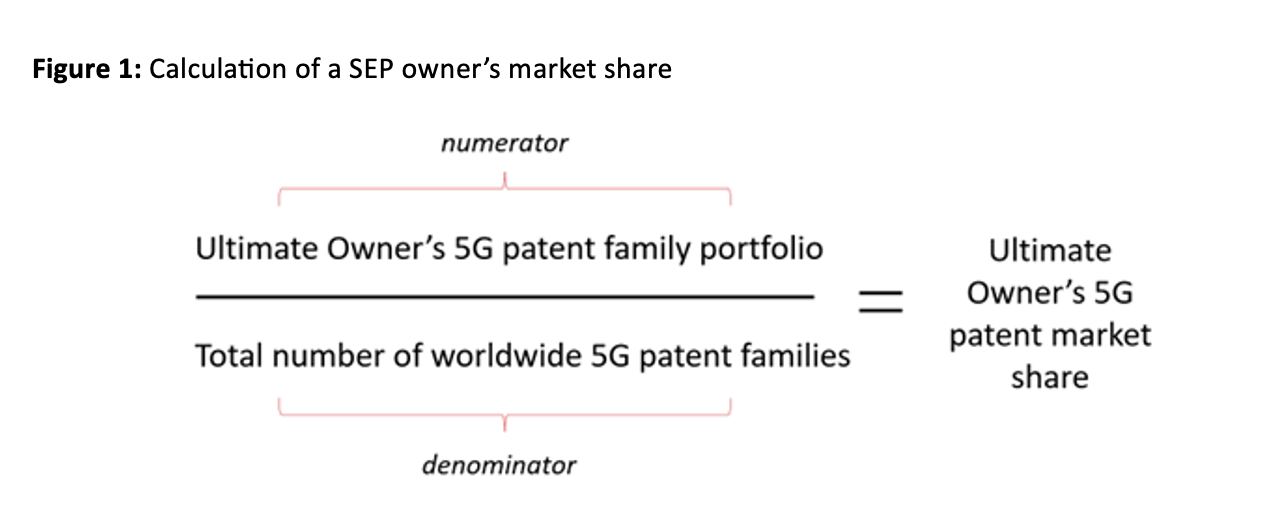
ETSI provides extensive databases encompassing patents related to 3G, 4G, or 5G technologies, serving as a comprehensive repository of potentially essential patents. However, the patents listed in ETSI’s declared patents list are all self-declared. In other words, neither the SEP owner nor ETSI, nor any third party, conducts an analysis to verify whether the listed patents are standard essential and valid. Consequently, there are no claim charts available in the database. Several studies evaluating 3G and 4G patents (e.g. Goodman and Myers, 2006), Fairfield Resources, 2007) have concluded that only about 20-30% of the declared patents in the ETSI database are essential and the essentiality rate for 5G is expected to be 44as low as 10-15% (e.g. M Noble, J Mutimear, R Vary, 2019) or T Pohlmann, M Buggenhagen and M Richter, 2023). Determining the essentiality of declared patent portfolios requires assessing both the SEP owner’s portfolio (numerator) and the overall number of SEPs (denominator), as illustrated in Figure 1 for the example of 5G. However, considering there are around 45,000 declared and granted patent families solely for 5G, it becomes unfeasible to value and determine the essentiality of all declared patents.
In other words, creating claim charts for all patents to determine their essentiality for the denominator is economically unfeasible for most standards like 4G, 5G, Wi-Fi or HEVC/VVC. Rigorous claim charts are too expensive and time consuming to produce.
How Expensive are Rigorous Claim Charts?
In a recently published study (Economic impact assessment on Standard Essential Patents, EU Commission, 2023) the authors interviewed subject matter experts from the United States, Europe and India about the cost and time needed for different rigorous levels of SEP claim charting. The identified experts provided average time and cost estimates.
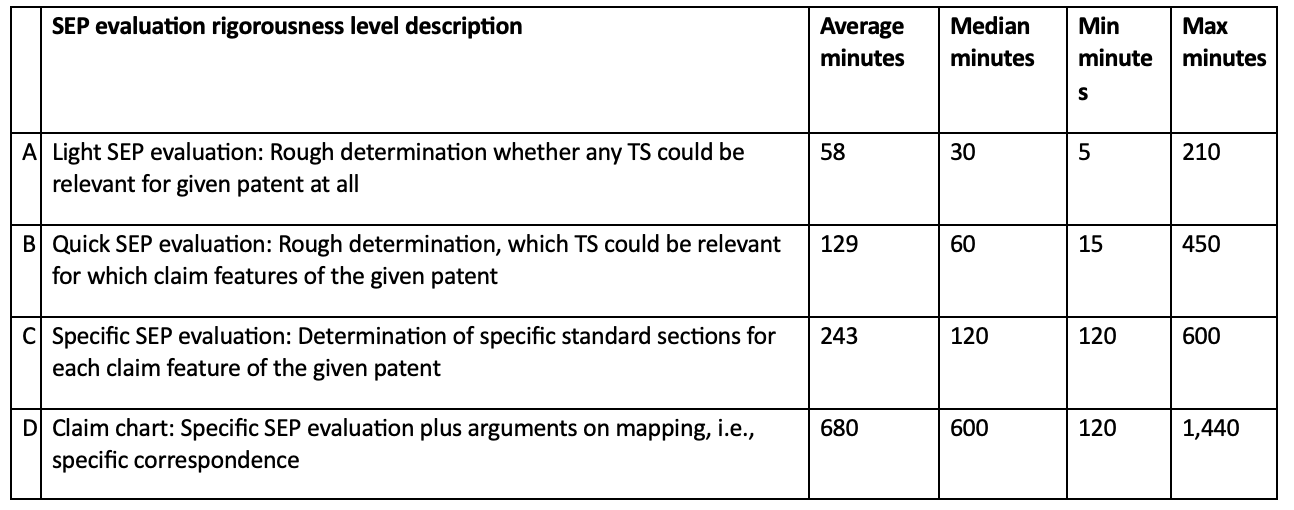
Before large budgets are spent on rigorous claim charting, some companies may also employ experts to do a first “light” SEP determination. During this initial evaluation, experts only have an average of 30 minutes to determine if a patent’s claims are potentially mappable to a standards section.
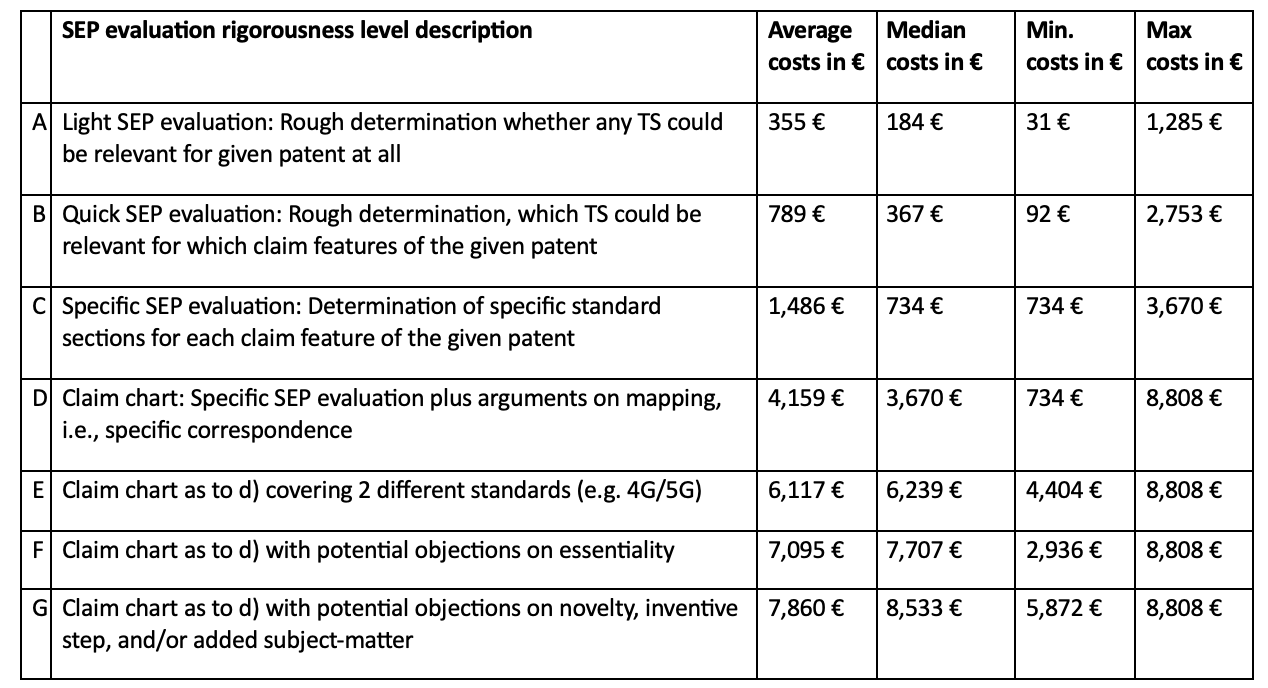
The study’s authors defined different levels of rigor for claim charting and provided average time and cost estimates for each level, as reported by the interviewed experts. The experts assumed that rigorous claim charting starts at the level D (see table 1 and 2). As to this definition, rigorous claim charting ranges start from an average cost of 4,159€ going as high as 7,860€ (from level D to level G) for just one single patent, which is often just a representative of a globally filed patent family. Considering the 45,000 5G declared patent families that are active and granted in at least one worldwide jurisdiction, the cost to claim chart all of them would be around 187 and 358 million Euros, which is equivalent to USD 200-378 million. This is the budget needed to identify the denominator for only 5G patents (figure 1).
Table 1: Average hourly rates x averages hours needed (Table 2) for different claim charting rigorous levels (Economic impact assessment on Standard Essential Patents, EU Commission, 2023)
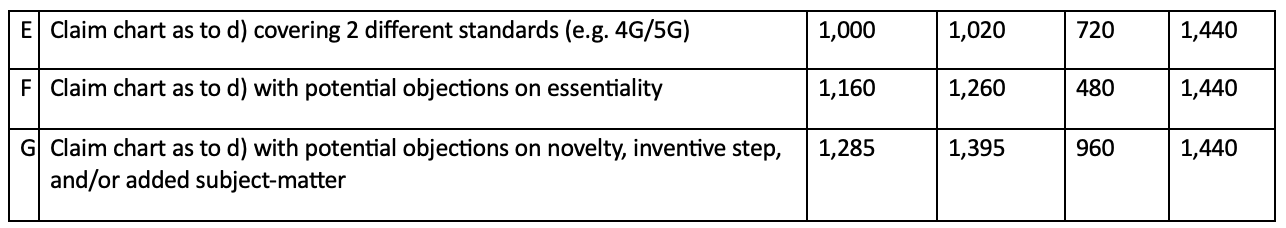
Not only are the costs for claim charting high, but the hours of expert work needed are extraordinary. If we look at Table 2 and consider rigorous level D to G, we assume for one patent we would need one expert to spend one day for level D and up to 2 days for rigorous level G. 1-2 days per patent would be 45,000 days to 90,000 days for all granted and active 5G patents which is 123 to 246 years. To claim chart all these patents within a year we would need a group of 123 to 246 experts. Finding neutral experts without vested interests is a key challenge in FRAND determination cases for negotiating parties and local courts.
Table 2: Average needed for different claim charting rigorous levels (Economic impact assessment on Standard Essential Patents, EU Commission, 2023)
SEP Claim Chart Sampling
Claim charting each and every patent is economically not feasible. Economic research provides evidence that representative samples of claim charts representing a fraction of all patents are as accurate as claim charting each and every patent. However, the challenge is that the sample size must be big enough.
Sampling is not about the percentage but about the actual amount of sample data. There are some simple mathematical rules to start with. Most statisticians agree that the minimum sample size to get any kind of meaningful result is 100 (Fisher, Ronald Aylmer. “Theory of statistical estimation.”, 2008). In other words, for the essentiality determination of declared patents, portfolios of patents smaller than 100 patent families will need claim charts for each single patent and sampling is not possible.
A sufficient maximum sample size is around 10% of the population, as long as this does not exceed 1,000. For example, in a population of 5,000, 10% would be 500. In a population of 200,000, 10% would be 20,000. This exceeds 1,000, so for 200,000, a sample of 1,000 is sufficient. In other words, the maximum sample size for identifying the essentiality of a patent portfolio or a whole SEP landscape must not be larger than 1,000 (Schönbrodt, D., M. Perugini. “At what sample size do correlations stabilize?”, 2013).
In a more detailed and granular analysis, the sample size of claim charts needed for a given declared patent portfolio shows that the sample size also depends on the essentiality rate (Mallinson, Keith, Essentiality Checks Might Foster SEP Licensing, 2022). To simplify the example, here we stick to the simple rule of a minimum sample of 100 and a sample of at least 10% until a maximum sample of 1,000. Let’s use the scenario of companies with 5G patent portfolios where we observe about 45,000 declared active and granted patent families (based on the INPADOC family definition with families granted in at least one worldwide jurisdiction). Here the top 13 5G patent owners have declared more than 1,000 patent families (granted in at least one worldwide jurisdiction) and for these portfolios, we would need to claim chart 10% randomly selected patents to have a big enough sample size which results in about 4,000 patents. These companies represent about 35,000 declared patent families. For the remaining SEP portfolios however, we must claim chart always at least 100 patents, because the portfolios are below 1,000 patent families. Following this rule, the data shows we will need to chart another 8,700 patents to cover smaller portfolios considering only the top 100 5G patent owner.
In summary, we would need claim charts for 4,000 (large portfolios) + 8,700 (small portfolios) = 12,700 patent families representing 28,2% of all declared active and granted 5G patent families, assuming we always claim chart only one family representative. While data sampling is statistically proven to be an accurate representative of a larger population, following the mathematical rules of sampling shows that identifying samples for the 5G portfolios of the top 100 would almost require claim charting of 1/4 of all the declared patent families. Costs and time needed would still be very high. To rule out any systematic bias when sampling claim charts, the patent selection must be truly random. Also, a sample is only a representative of the population at the time when the analysis was conducted. Since the data on patent declarations is constantly changing, samples need to be updated and maintained which is again costly and time consuming.
Systematic Bias of Charting Errors
Claim charts differ in quality and accuracy. As described in tables 1 and 2, most experts would only consider rigorous level D to G to represent actual claim charts. But claim mapping or actual charting is not only about accuracy, it’s also about a systematic bias.
Let us assume that the subject matter expert who conducts the claim chart is neutral with no prior knowledge of the patent owner, and assuming that the charting of any patent is done in a double-blind process involving two experts with different backgrounds and work experiences. In such an example, we can rule out the human bias (to a certain extent). However, if claim charts are not rigorous (not at least level D or even higher as to table 1 and 2), claim mapping results of a “light” SEP determination of only 20 minutes have shown that patent mapping typically over-identifies essentiality. In other words, the number of false positives (patents that are not essential but wrongly identified as essential) is larger than the number of false negatives (patents that are essential but wrongly identified as not essential).
In TCL v. Ericsson, a random sample of 3G and 4G declared patents was mapped by experts who spent on average only about 20 minutes per patent. Afterwards, a second expert looked at some of the mapped patents in a more rigorous approach. The results showed that the number of false positives was much higher than the number of false negatives.
The 2020 published EU study (Pilot study for essentiality assessment of Standard Essential Patents, 2020) investigated the technical and institutional feasibility of a system that ensures better essentiality scrutiny for SEPs. Here, a technical feasibility was assessed in a pilot experiment, in which a variety of assessors (among others patent examiners from the patent offices) evaluated patents for their actual essentiality. Also, in this study the number of false positives was larger than the number of false negatives. To a subject matter expert, these results are not surprising. Missing a patent that is essential, even if only looked at for a few minutes, is not difficult and errors are less likely. However, identifying truly essential patents where all claim elements can be mapped to standards section and thus confirming a patent as truly essential for any implementation is much more complex and almost impossible when only mapping claim in 20 minutes.
But what is the problem with false positives? Even if the whole claim charting process is neutral, a high number of false positive errors in claim charting, whether that be samples or claim charting all patents, will always benefit companies with lower essentiality rates compared to companies with higher essentiality rates. The extreme example is a company that only declares essential patents, compared to a company that declares patents that are essential at a rate of 5%. While the company that only declares essential patents is not influenced by false positives, the company with only 5% will increase its essentiality rate with false positives. The example also works when the essentiality rate is not at 100% but just higher compared to another declared portfolio. The only way to reduce this systematic claim charting bias is to ensure rigorous claim charting, so that, to a certain extent, false positives are as likely as false negatives.
A Complex Process
SEP determination is complex and too often subject to systematic bias. When using declared patents, rankings of declared patents or some kind of essentiality determination, it is important to be aware of the bias and data limitations when determining the value and share of an SEP owner’s portfolios in the market. SEP licensing involves complex negotiations. Cleaned and curated patent declaration data can serve as one reference point among others, including details on claim charts, past contracts, comparable license agreements, subject matter expert testimony and more. Such evidence must be thoroughly evaluated to make accurate assumptions about the essentiality, value and market share of a given SEP portfolio.
Image Source: Deposit Photos
Author: NiroDesign
Image ID: 65452567
![[Advertisement]](https://ipwatchdog.com/wp-content/uploads/2024/04/UnitedLex-May-2-2024-sidebar-700x500-1.jpg)
![[Advertisement]](https://ipwatchdog.com/wp-content/uploads/2024/04/Artificial-Intelligence-2024-REPLAY-sidebar-700x500-corrected.jpg)
![[Advertisement]](https://ipwatchdog.com/wp-content/uploads/2024/04/Patent-Litigation-Masters-2024-sidebar-700x500-1.jpg)

![[Advertisement]](https://ipwatchdog.com/wp-content/uploads/2021/12/WEBINAR-336-x-280-px.png)
![[Advertisement]](https://ipwatchdog.com/wp-content/uploads/2021/12/2021-Patent-Practice-on-Demand-recorded-Feb-2021-336-x-280.jpg)
![[Advertisement]](https://ipwatchdog.com/wp-content/uploads/2021/12/Ad-4-The-Invent-Patent-System™.png)


Join the Discussion
4 comments so far.
Robert Rountree
January 23, 2024 05:55 pmTim Pohlmann, my comments were directed to the second phase of your post. From your own words the licensor presentation has little credibility, because of the built-in bias in the numerator and the inability to practically determine the denominator.
The only problem with the first phase is that claim charts don’t prove validity. They can and should show how claims read on a standard. This is likely to get the attention of a potential licensee. But proof of validity often requires licensing or litigation. This is not only due to hidden prior art. It is also because the potential licensee is likely to do a better search than the licensor.
Tim Pohlmann
January 23, 2024 03:44 pm@Robert Rountree
Please read the beginning of my article carefully where I exactly that for determining essentiality evidence of one patent is enough:
”
In the technical phase, the SEP licensor must provide evidence that at least one patent of its portfolio is valid and standard essential. This is done by providing rigorously conducted claim charts that map claims against the standard’s sections, providing evidence that all claim elements read on the technical standard specification. Typically, only a few claim charts are needed in this first technical phase, since only one patent must be valid and essential to make the case that the standard implementing party is infringing.
”
However, this article discusses the commercial phase not the technical phase. And this article does not focus on declared patents but on approaches to use samples of claim charts to understand the rate of essentiality. Patent declarations can be a starting point to understand portfolio sizes both for those who own the portfolio and those who will take a license. Samples of claim charts can help to understand the essentiality of these declared portfolios. But all that is not straight forward and can easily lead to a systematic bias, if claim charts are not rigorous and samples are too small.
Anon
January 23, 2024 11:33 amNot sure why the derogative of the last sentence ‘needed’ to be added.
Robert Rountree
January 23, 2024 08:47 amThis analysis seems to focus on a patent owner’s self-declared essential patents for a standard (numerator) and a total number of standard essential patents (SEPs) for the same standard (denominator) as a measure of “essentiality” of the patent owner’s portfolio.
The analysis identifies two major problems: First, the numerator has a built-in bias from the patent owner such that only 10-15% of self-declared SEPs are really essential to the 5G standard. That’s about 85-90% puffing. Second, it is argued persuasively that the denominator is practically impossible to calculate.
Therefore, it appears that the analyzed fraction is meaningless! It is really just a false premise that leads to a false conclusion. The false premise is that the analyzed fraction is related to “essentiality.” The false conclusion is that it’s practically impossible to determine “essentiality.”
The truth is that it only takes one true SEP for a given standard. Then anyone who practices the standard necessarily infringes the true SEP. Just ask any patent troll.