
U.S. Companies Dominate in Computer, Med Tech and Pharma Applications; Qualcomm Files Most U.S. Patent Applications
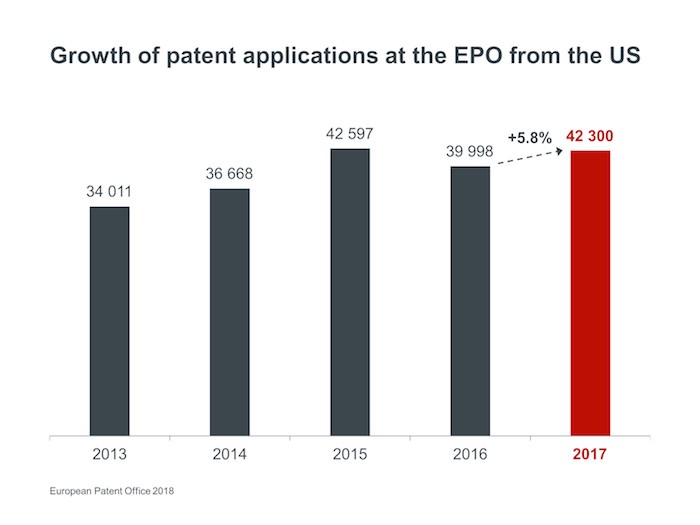
 March 7, 2018 – The European Patent Office (EPO) today announced that U.S. companies and inventors filed 5.8% more patent applications at the European Patent Office (EPO) in 2017 than in the previous year, according to the EPO’s Annual Report published today. This follows a decrease in applications in 2016 (-6.1%), which had been a knock-on effect of changes in U.S. patent law introduced in 2013.
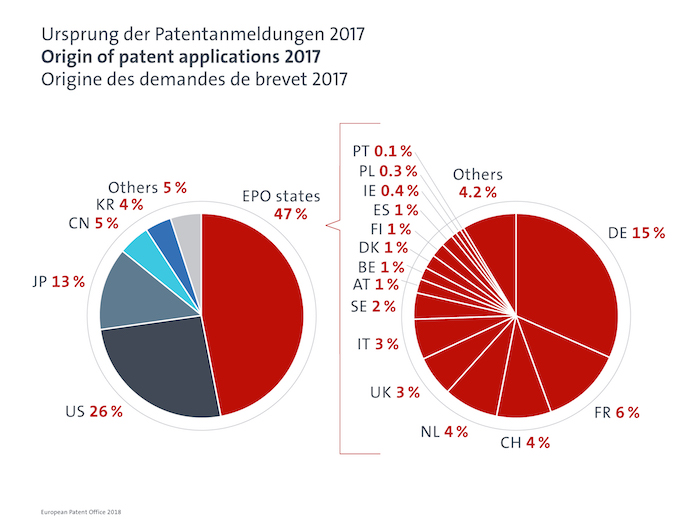
Last year, U.S. companies filed 42,300 patent applications with the EPO (2016: 39,998), the second highest figure of the past ten years. With a share of 26% of the total, the U.S. remained by far the biggest filing country at the European Patent Office (see below).
Overall, the European Patent Office received nearly 166,000 European patent applications in 2017, an increase of +3.9% compared to 2016 and a new record number (Fig.: Growth of European patent applications). There was strong growth again in applications from China (+16.6%), which overtook Switzerland to make it into the top five countries for the first time, along with the U.S., Germany, Japan, and France (see below).
“In terms of patents, 2017 was a positive year for Europe,” said EPO President Benoît Battistelli. “The growing demand for European patents confirms Europe’s attractiveness as a leading technology market. European companies, too, filed for more patents than ever before – evidence of their strength in innovation, and of their confidence in our services. The EPO has successfully responded to the sustained with efficiency measures that have increased production, productivity, and timeliness. At the same time, we have enhanced the quality of our products and services. The EPO’s staff should be commended for their outstanding efforts in 2017, which led to the Office’s best results ever.”
U.S. Companies Strongest in Computers, Medical Technology and Pharmaceuticals
U.S. companies filed European patent applications in a wide range of technologies but were particularly dominant in several of the ten most important technical fields at the EPO. They accounted for 40% of all patent applications in Computer Technology, 37% of all patents filed in both Medical Technology and Pharmaceuticals, and 32% in Biotechnology.
In the company ranking, U.S. firms had a strong presence in many fields: Microsoft was the leading patent applicant at the EPO in Computer Technology, with Intel in second place, Qualcomm in fifth and Google in seventh. In Medical Technology, Johnson & Johnson was No. 2 (behind Royal Philips), Medtronic No. 3, Boston Scientific No. 5, and Procter & Gamble No. 7. United Technologies was the top patent applicant at the EPO in Transport. Deere & Company was the leading applicant at the EPO in “Other Special Machines,” a field covering inventions in several areas from agriculture to 3D printing.
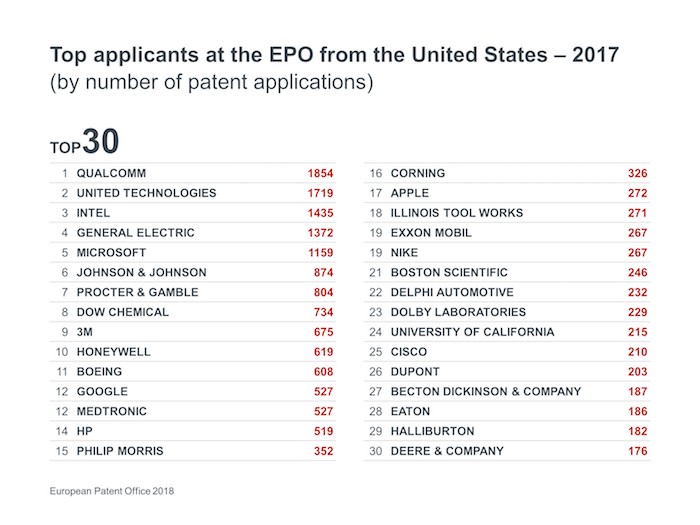
Qualcomm New No.1 U.S. Patent Applicant
With 1,854 patent applications (up by +8.8%), Qualcomm was the most active U.S. patent applicant at the EPO, followed by United Technologies (1,719 applications / -16.8%), Intel (1,435 / +13.2%), General Electric (1,372 / -15.7%), and Microsoft (1,159 / +17.8%) (see below).
Most Patents Filed in Medical Technology
Medical Technology remained the field with the greatest number of patent applications at the EPO overall (up +6.2%), again followed by Digital Communications and Computer Technology (Fig.: Technical fields with most applications). The strongest growth (of the top 10 fields) was recorded in Biotechnology (+14.5%), followed by Pharmaceuticals (+8.1%) and Measurement (+6.6%).
Huawei Heads EPO Company Ranking, Qualcomm No. 5
For the first time in the history of the EPO, a Chinese company, Huawei, filed the most European patent applications last year. Siemens moved up from sixth place to second, followed by LG, Samsung and Qualcomm. The top 10 list of applicants was made up of four companies from Europe, three from the U.S., two from Korea and one from China (Fig.: Top 10 applicants in 2017). Of the top 50 applicants at the EPO, 14 of them were U.S. companies (Fig.: Top 50 applicants in 2017).
For detailed statistics and a review of EPO activities in 2017, see the EPO’s Annual Report at: www.epo.org/annual-report2017
![[Advertisement]](https://ipwatchdog.com/wp-content/uploads/2024/04/Patent-Litigation-Masters-2024-sidebar-early-bird-ends-Apr-21-last-chance-700x500-1.jpg)

![[Advertisement]](https://ipwatchdog.com/wp-content/uploads/2021/12/WEBINAR-336-x-280-px.png)
![[Advertisement]](https://ipwatchdog.com/wp-content/uploads/2021/12/2021-Patent-Practice-on-Demand-recorded-Feb-2021-336-x-280.jpg)
![[Advertisement]](https://ipwatchdog.com/wp-content/uploads/2021/12/Ad-4-The-Invent-Patent-System™.png)


Join the Discussion
2 comments so far.
Anon
March 8, 2018 10:43 amBenny,
I do not think that you are the one missing something in regards to IBM’s chosen strategy.
Benny
March 8, 2018 05:53 amIBM were granted over 9000 US patents last year, but they do not appear on the EPOs top 30 list for applications.
Every competitor in my field files applications both in the EU and the US so as to covert the actual market, not just post numbers in annual review power point presentations.
I’m missing something in my understanding of IBM’s IP strategy.