This is part 2 of a 6-part series on our 2016 Patent Market Report. To begin reading from the beginning please see 2016 Patent Market Report: An Overview.
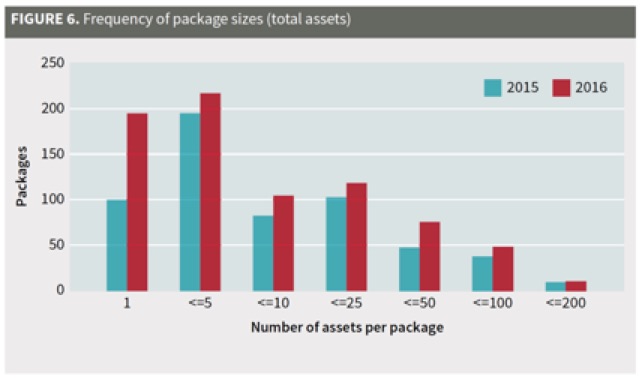
 2016 saw a significant rise in both the number of patent brokers and patent packages, with the latter mostly due to IAM Market packages. Though the frequency of package sizes is similar to 2015, there is a remarkable increase in single-asset packages in 2016. While the growth of single-asset packages is again attributed to IAM Market, we continue to see a trend of the market favoring smaller packages due to their marketability.
As in previous years, our analysis focuses on the brokered patent market because it is open to all buyers. We work with many brokers to help our clients buy patents. When helping our clients sell patents, we offer the service of assisting patent owners in selecting a broker. As such, we have identified useful skills which brokers bring to the table, including:
- initial filtering to identify suitable patent assets to sell;
- selection of viable sellers, along with some certainty that the chosen target is willing to sell;
- screening of patents and identification of important patents and claims;
- pricing guidance;
- guidance for sellers with regard to sales terms and timelines;
- definition of a process for diligence, bidding and sales;
- development of evidence of use (EOU); and
- tougher negotiation on pricing.
Brokers also have the ability to sell. For many, their network of potential buyers expands well into the hundreds; they actively seek out specific buyers’ needs and can manage a sales process where only a few percent of contacts may have any interest. When we help a client to evaluate whether to sell directly or work with a broker, we look to whether that client has skills similar to those possessed by patent brokers, which often resemble those found in the corporate development department of a company.
Brokers with five or more packages
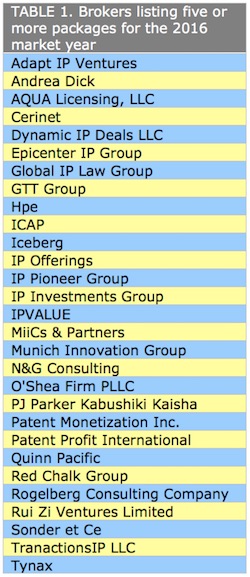 The total number of brokers this year has risen to 73 (from 60 last year). However, on average, brokers are listing slightly fewer packages – despite the growth in listings. Many IAM Market listings are for sale by the owner and therefore excluded from broker analysis, thereby bringing down the total number of listings to divide between the increased number of brokers. Table 1 provides a listing of brokers with five or more packages for the 2016 market year.
Further, a smaller group of brokers continues to bring most packages to market: 15 brokers brought 10 or more packages to market, while 72% of the packages were brought by brokers which brought five or more packages to market (down from 80%). The top four brokers accounted for 35% of listed packages (last year it was 34%).
As in previous years, we continue to see little technology specialization among brokers, with the exception of some affiliated with semiconductor reverse-engineering houses and some which focus more on hardware.
Figure 2 shows that while a few brokers were particularly successful (green circle) or unsuccessful (red circle), brokers which brought more packages to market did not show a higher sales rate. Some brokers are clearly struggling with many packages and very few sales. Unsurprisingly, those bringing the most packages to the market approached the industry sales rate. We used the 2015 calendar year for this analysis to allow sufficient time for sales to close and be recorded.
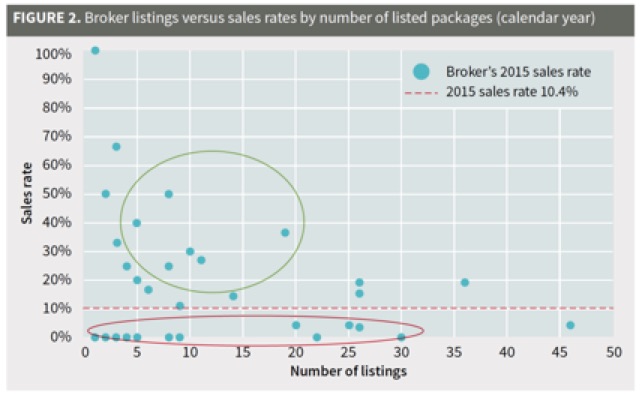
In Figure 2, ICAP Partners – with 136 listed packages in the 2015 calendar year – has so many packages that it did not fit on the chart, although it is included in the overall average. Thus, the average sales rate is heavily impacted by ICAP’s outcomes. The average of 10.4% for 2015, compared to the same analysis for the 2014 calendar year at the same time, indicates that the sales rate for packages listed in 2015 has dropped by almost 50%.
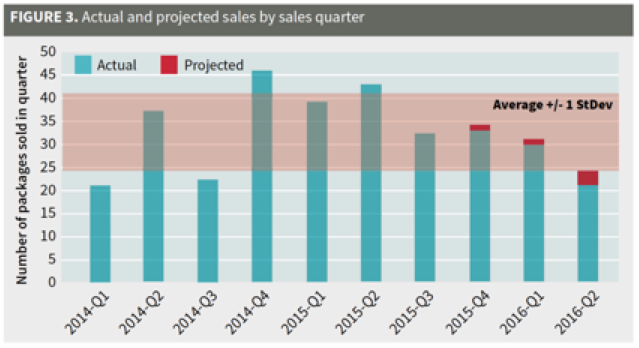
The 10.4% sales rate in Figure 3 highlights the difficulty in selling newly listed packages and, accordingly, suggests that this would be a tough year for new brokers entering the market. However, overall sales rates are more robust; the total number of packages transacted did not drop by nearly as much (see Figure 3). The actual number of packages transacted each quarter from 2014 to the first half of 2016 has stayed within a fairly narrow range, mostly one standard deviation from the average. Nonetheless, the sales rate for the 2015 calendar year listings shown in Figure 2 may indicate a downward trend in sales. We discuss sales rates further in Part 4 of our 2016 Patent Market report.
Packages
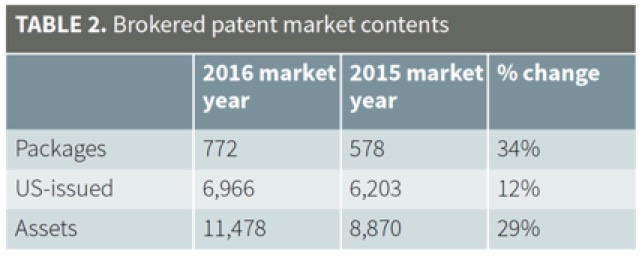
At 772 packages (578 last year), the patent market has expanded. The 194 packages on IAM Market account for virtually all of the growth. Without IAM Market, the number of packages would have stayed flat and the number of total assets and US-issued patents would have fallen (see Table 2). We have benchmarked our deal flow with other large corporations and defensive aggregators; we receive a similar number of, or more, brokered packages, so we are confident that our numbers reflect the market. Interestingly, while the total number of assets increased fairly proportionally to the number of packages, the total number of US-issued assets did not. This may signify the beginnings of an increased focus on international assets, but US-issued assets still seem to be the driving factor in most listings.
Technology distribution
Overall, the market continues to present packages from a broad and varied set of technologies. With increased diversity and a healthy number of packages, assets are available in almost any high-tech category. When we receive a package, we use the package materials to categorize it according to our taxonomy of technical areas. This is a two-tiered classification, with 16 general technical categories and 107 sub-categories. As illustrated in Figure 4, the distribution of general technologies still skews towards software, although there has been growth in other areas.
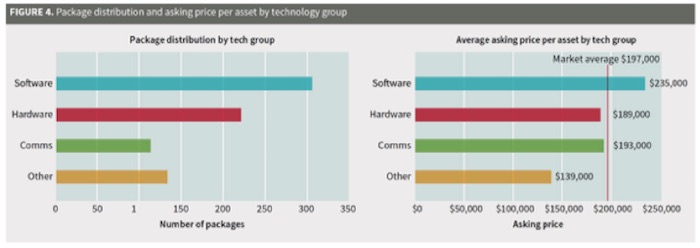
The increase in other types of packages was primarily due to postings on IAM Market, such as aerospace and materials. Finally, despite an increased number of total listings, there were drops in the number of listings for some Alice-affected technology areas, such as social networks, advertising and business process-financial (all sub-categories of software).
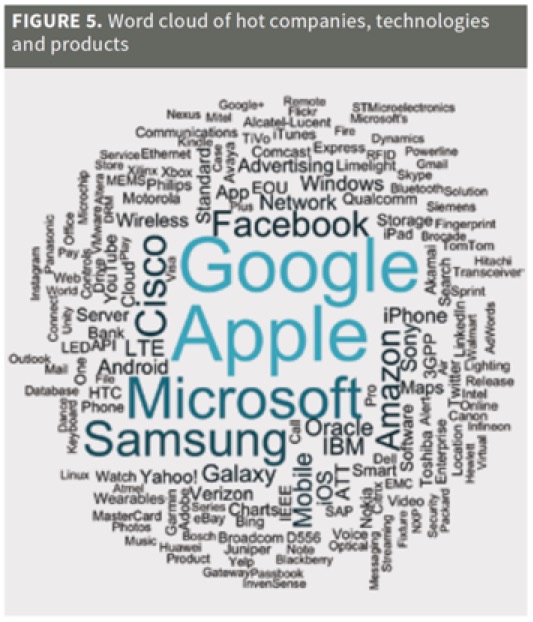
The word cloud in Figure 5 provides another way to visualize the focus of the brokered patent market. It highlights, by size, the hot companies, technologies and products identified in EOUs included with the packages. The impact of EOUs on a package is discussed further in Part 3 of our series. Focusing on the word cloud, one can get a sense of the hot areas where packages were marketed in the 2016 market year. Unsurprisingly, the biggest technology companies such as Google, Apple and Microsoft continue to be the favorite targets of patent sellers.
Package sizes
The distribution of package sizes (Figure 6) looks remarkably similar to last year, with one notable exception: there was a significantly higher percentage of single-asset packages. In the 2015 market year, single- asset packages dropped off nearly 30% from 2014, but they have returned via IAM Market in 2016. Most of these were packages listed for sale by the owner; excluding IAM Market from the data, single-asset packages fell overall. These single-asset packages decrease the average number of assets per package in the 2016 market year to 14.87, down from 15.34. Regardless, it is clear that the overall market continues to focus on smaller packages because they are more marketable.
CLICK HERE to CONTINUE READING… In Part 3 of our 2016 Patent Market Report, we’ll examine the art of patent pricing. How do you determine a fair price for a patent? What was the distribution of asking prices in 2016? We’ll also look into the importance of key diligence data and how you should deploy your diligence resources.

![[IPWatchdog Logo]](https://ipwatchdog.com/wp-content/themes/IPWatchdog%20-%202023/assets/images/temp/logo-small@2x.png)


![[Advertisement]](https://ipwatchdog.com/wp-content/uploads/2024/04/Patent-Litigation-Masters-2024-sidebar-early-bird-ends-Apr-21-last-chance-700x500-1.jpg)

![[Advertisement]](https://ipwatchdog.com/wp-content/uploads/2021/12/WEBINAR-336-x-280-px.png)
![[Advertisement]](https://ipwatchdog.com/wp-content/uploads/2021/12/2021-Patent-Practice-on-Demand-recorded-Feb-2021-336-x-280.jpg)
![[Advertisement]](https://ipwatchdog.com/wp-content/uploads/2021/12/Ad-4-The-Invent-Patent-System™.png)





Join the Discussion
2 comments so far.
JamesN
April 13, 2017 01:51 pmBe interesting to see part 3 if they address pricing for patent pending applications which are attached to an already granted patent (i.e. family of patent) or for that matter international application which are part of a granted US patent
patent leather
April 13, 2017 11:17 amHow do you think Intellectual Ventures’ cessation of buying activity will affect the broader market in general?